
Business solar PV: compare cash and credit over 20 years
A 30 kWc example in Sfax, two financing methods and charts to understand what remains available year after year.
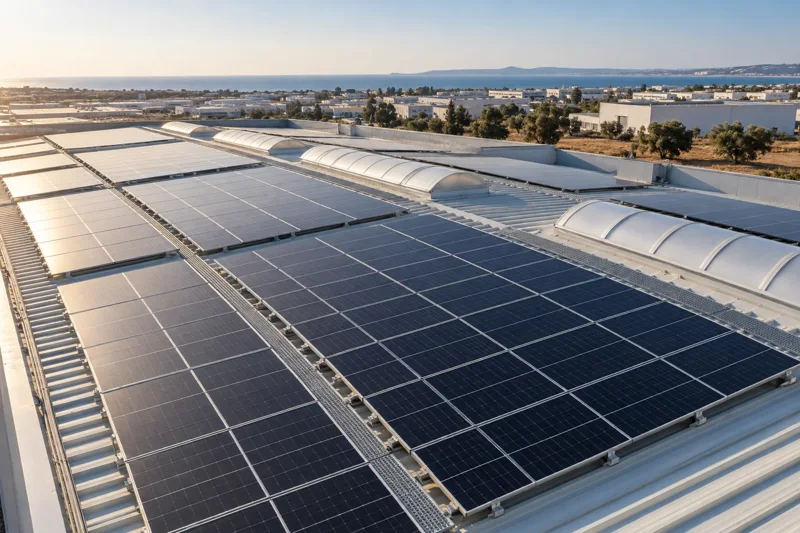
Solar can reduce a business’s electricity purchases, but savings and available cash are two different results. A loan lowers the initial contribution; its instalments then reduce available funds during repayment. This numerical example explains the difference.
Fictional educational example, not a customer installation or a commercial or banking offer. Amounts and terms explain the calculation. They are neither the price of a Tunisie PV installation nor financing offered by an institution. Revised: 31 October 2026.
Three results from the scenario:
- Here, 30 kWc generates about 50 946 kWh in the first year.
- Savings after operating costs reach about 12 091 DT before loan repayments and tax.
- Credit reduces the initial contribution from 90 000 to 27 000 DT, with instalments to budget for over seven years.
A fictional business with 30 kWc in Sfax
Imagine a site consuming 80 000 kWh a year, operating mainly during the day. We assume a fixed 30 kWc installation and the following parameters:
| Parameter | Case assumption |
|---|---|
| First-year generation | 50 946 kWh. |
| Share of generation consumed on site | 85 %. |
| Value of each avoided kWh | 0,300 DT excluding tax, an assumption rather than an official tariff. |
| Initial investment | 90 000 DT excluding tax. |
| Operating costs in year 1 | 900 DT, then +2 % a year. |
| Generation trend | −0,4 % a year after year 1. |
| Equipment replacement | 8 000 DT in year 12. |
| Subsidy and surplus value | No subsidy included; surplus assigned no value in this scenario. |
Generation comes from a PVGIS 5.3/SARAH3 calculation for Sfax, using crystalline silicon, ventilated mounting facing south at 30° and entered system losses of 14 %. The 1 kWc calculation is multiplied by thirty. The actual roof and shading still need assessment. Source: PVGIS, European Commission.
Generation varies by month

Show chart values
| Month | Generation (kWh) |
|---|---|
| January | 3 627 |
| February | 3 628 |
| March | 4 391 |
| April | 4 486 |
| May | 4 772 |
| June | 4 762 |
| July | 5 089 |
| August | 4 915 |
| September | 4 302 |
| October | 4 049 |
| November | 3 521 |
| December | 3 403 |
The model gives about 3 403 kWh in December and 5 089 kWh in July. The monthly curve helps compare this seasonality with business needs: a highly productive summer may also coincide with a factory shutdown.
The 85 % self-consumption rate is an assumption applied to this scenario. It must be confirmed through operating hours and a load curve. Similar monthly generation and consumption do not prove the energy is used at the same time.
ANME’s technical guide recommends studying monthly generation, self-consumption rates and demand coverage, among other factors. We use its method; its older schedules are not presented as current terms. Source: ANME, solar PV feasibility guide, October 2017 edition.
How much electricity and money are saved in year 1?
The business uses about 43 304 kWh of solar energy: 50 946 × 85 %. This covers 54,1 % of its annual 80 000 kWh, not 85 % of its needs. The 85 % is the share of solar generation used directly.
At an assumed avoided cost of 0,300 DT excluding tax/kWh, energy savings reach 12 991 DT. After 900 DT in operating costs, annual project cash flow is about 12 091 DT, before financing and tax.
The remaining roughly 7 642 kWh earns no revenue in our model. This is a modelling choice, not a statement about the customer’s sale or compensation rights. Actual treatment depends on the connection and contract.
Cash purchase: a larger initial outlay
With cash purchase, the business commits 90 000 DT at the outset. It then retains savings net of operating costs. Simple payback, calculated using the first year alone, is close to 7,4 years.
The complete annual calculation includes declining generation, rising costs and replacement. Cumulative cash flow turns positive during the eighth year. This period is neither a guaranteed return nor an internal rate of return.
Credit: 27 000 DT upfront and 84 monthly payments
For comparison, assume 70 % of the project is financed: 63 000 DT borrowed, with 27 000 DT upfront. At a hypothetical nominal annual rate of 8 %, over 84 equal monthly instalments, the calculated payment is about 981,93 DT per month, excluding insurance and fees.
Annual debt service reaches 11 783 DT. In year 1, about 308 DT therefore remains after operating costs and repayments. This margin is small. Under the selected assumptions, it turns slightly negative in years 6 and 7; financing does not guarantee positive cash flow every year.
From year 8, repayments stop. Annual cash flow then returns to about 11 598 DT before tax. Maintenance continues, and the replacement planned in year 12 temporarily reduces available cash flow.
Read the cumulative cash-flow curve

Show chart values
| Year | Cash-purchase cumulative total (DT) | Credit cumulative total (DT) |
|---|---|---|
| 0 | -90 000 | -27 000 |
| 1 | -77 909 | -26 692 |
| 2 | -65 887 | -26 454 |
| 3 | -53 936 | -26 286 |
| 4 | -42 055 | -26 188 |
| 5 | -30 245 | -26 161 |
| 6 | -18 505 | -26 204 |
| 7 | -6 836 | -26 318 |
| 8 | 4 762 | -14 720 |
| 9 | 16 289 | -3 193 |
| 10 | 27 745 | 8 262 |
| 11 | 39 128 | 19 646 |
| 12 | 42 440 | 22 958 |
| 13 | 53 680 | 34 198 |
| 14 | 64 848 | 45 366 |
| 15 | 75 943 | 56 460 |
| 16 | 86 965 | 67 482 |
| 17 | 97 913 | 78 431 |
| 18 | 108 789 | 89 307 |
| 19 | 119 590 | 100 108 |
| 20 | 130 318 | 110 836 |
| End of period | Cash: cumulative total after investment | Credit: cumulative total after contribution and debt |
|---|---|---|
| Year 0 | −90 000 DT | −27 000 DT |
| Year 5 | −30 245 DT | −26 161 DT |
| Year 10 | +27 745 DT | +8 262 DT |
| Year 20 | +130 318 DT | +110 836 DT |
Borrowing preserves 63 000 DT at the outset, but adds around 19 482 DT in interest. Cumulative cash flow on equity becomes positive during the tenth year. The table shows cumulative nominal cash flows: they do not account for the time value of money.
Prepare your free, no-obligation assessment. Your bills, operating hours, name, phone number and email will help the team review the calculation with you.
Assumptions can change the decision
If only 65 % of generation is consumed directly, simple payback rises to around ten years; at 95 %, it is close to 6,6 years, with all other assumptions unchanged. Operating hours and shutdowns can therefore matter as much as installed capacity.
This model excludes VAT and its timing, corporate income tax, loan fees and insurance, commissioning delays and working capital requirements. It assumes no exemption or automatic VAT recovery. An actual assessment includes these items and checks the applicable tariff on the company's bills.